Building a Comprehensive Full-Stack Observability Ecosystem: Insights from Our End-to-End Approach
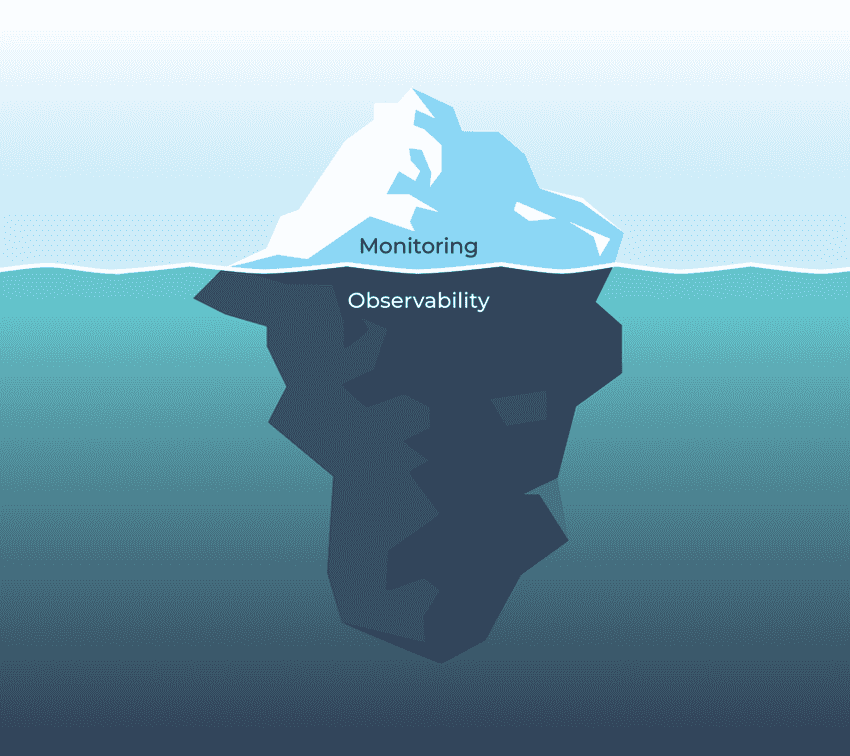
Full-stack observability offers a complete, 360-degree view of your system, covering everything from application performance to infrastructure health. By utilizing an integrated suite of monitoring, logging, tracing, and profiling tools, observability helps organizations identify, troubleshoot, and resolve issues before they cause major disruptions. This approach not only enhances decision-making and system performance but also boosts overall reliability.
At Grootan, we've crafted an observability strategy that integrates advanced tools to collect, analyze, and visualize data across our tech stack, ensuring continuous infrastructure monitoring, performance optimization, and a seamless user experience.
The Importance of Observability
Observability is more than just monitoring system performance—it's about leveraging data to drive actions that enhance both user experience and operational efficiency. Here’s why it’s vital:
Proactive Issue Detection
Observability enables early detection of anomalies, helping to minimize downtime and prevent major incidents.Faster Troubleshooting
By correlating metrics, logs, and traces, teams can quickly identify the root causes of issues, reducing Mean Time to Resolution (MTTR) and lowering operational costs.System Optimization
Continuous monitoring and profiling uncover inefficiencies, helping to optimize system performance, cut costs, and scale operations effectively.
Our Journey to Full Observability
At Grootan, our path toward full-stack observability was driven by the need for a scalable and efficient monitoring solution that aligned with both our technical and business needs. We initially explored a variety of observability options, from open-source stacks like Grafana and ECK to enterprise solutions such as New Relic and Dynatrace. However, we faced challenges like high costs, missing features, and excessive resource usage.
We eventually turned to the Grafana stack, which offered a comprehensive suite of tools for logs, metrics, traces, profiling, and alerting. While tools like Beyla, Faro, and Alloy were outside the scope of our current needs, Grafana provided the perfect balance of scalability, cost-effectiveness, and functionality for our observability requirements.
Our Observability Ecosystem
To build a robust and scalable observability ecosystem, we carefully selected the following tools for their specific roles:
Prometheus Agent, Exporters, and Mimir
- Role: Scalable metric collection and storage
- Functionality: Prometheus gathers high-performance metrics, while exporters convert system data (e.g., PostgreSQL stats) into Prometheus-compatible formats. Mimir ensures long-term metric storage and visualization in Grafana, offering better scalability than Prometheus alone.
Loki and Promtail
- Role: Centralized logging
- Functionality: Promtail collects logs from Kubernetes nodes and ships them to Loki, which indexes and stores the logs. This setup enables centralized log management, with data retention policies that move old logs to MinIO for cost-effective storage.
Grafana
- Role: Unified data visualization and alerting
- Functionality: Grafana integrates with Prometheus, Loki, Mimir, Tempo, and Pyroscope, providing an intuitive interface for visualizing system health across various data types. It includes dashboards that help teams assess application and infrastructure status, and it features an integrated alerting system.
Tempo
- Role: Distributed tracing
- Functionality: Tempo allows us to trace requests across distributed systems, pinpointing performance bottlenecks and improving overall workflow efficiency.
Pyroscope
- Role: Continuous profiling
- Functionality: Pyroscope continuously profiles our applications to uncover performance issues, enabling better resource utilization and optimization.
Alloy Agent
- Role:
- Collects Kubernetes events
- Records Prometheus and Loki alert rules
- Functionality: The Alloy Agent discovers and loads PrometheusRule Kubernetes resources into Loki or Mimir instances. It also collects Kubernetes events for storage in Mimir.
- Role:
Uptime Kuma/Blackbox Exporter
- Role: External service monitoring
- Functionality: These tools monitor the availability of external services, ensuring SLAs are met and enabling quick detection of issues with external dependencies.
MinIO
- Role: Object storage
- Functionality: MinIO provides object storage for logs, metrics, traces, and profiles. Data retention policies automatically move older data to MinIO, helping reduce long-term storage costs. Unneeded data is permanently removed to maintain storage efficiency.
Beyla
- Role: Deep system observability
- Functionality: Beyla leverages eBPF technology to provide low-level insights into system performance and security, though it isn't part of our current stack.
Faro
- Role: Frontend monitoring
- Functionality: Faro helps monitor frontend performance, enabling us to detect and resolve client-side issues for better user experience.

Streamlined Deployment with Helm and ArgoCD
Managing a comprehensive observability stack can be complex, but we simplified this with a custom Helm chart that consolidates all the necessary components. This enables us to deploy the entire observability ecosystem with a single command. By adjusting a few parameters—like storage volumes or ingress settings—we can quickly tailor the stack to our needs. We also preconfigured essential integrations between Grafana, Loki, Mimir, and MinIO, including datasources and retention policies. This approach reduces maintenance overhead and ensures smoother operations.
To maintain consistency and reliability, we use ArgoCD GitOps to synchronize our infrastructure with the desired state defined in Git repositories. This eliminates configuration drift and simplifies deployments.
Proactive Alerting and Monitoring
Alerting is a vital component of our observability strategy. While metrics provide valuable insights into system health, alerts help us resolve issues proactively. We use Prometheus rule-based alerting to set thresholds for key metrics like response time and error rates. When an alert is triggered, Grafana processes it and notifies the relevant team via Slack or other channels, ensuring a rapid response to incidents.
This system allows us to resolve issues quickly, minimizing downtime and mitigating impacts.
Conclusion
By adopting a full-stack observability approach, Grootan has achieved unparalleled visibility into our entire infrastructure, enabling us to optimize system performance, swiftly address issues, and improve the user experience. With a carefully selected set of tools, simplified deployment via Helm and ArgoCD, and robust alerting mechanisms, we’ve built an observability ecosystem that drives growth and operational efficiency. This holistic approach ensures that we stay proactive in identifying and resolving problems, keeping our systems running smoothly for both our teams and customers.
